TopographX
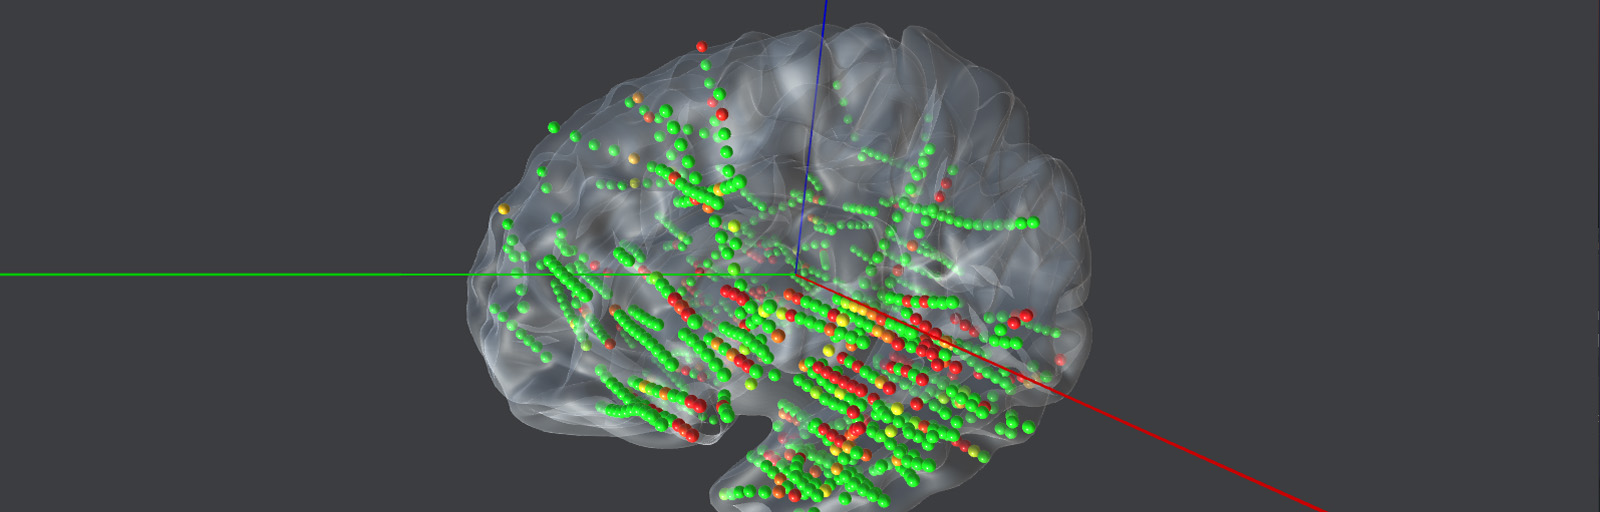
To answer these problems we decided, in partnership with PhD students at the Integrative Neuroscience & Cognition Center, to create TopographX. The intial goals of this software were to display the position of electrodes in a 3D brain mesh, link their color to data specified by the user and display these values over time.
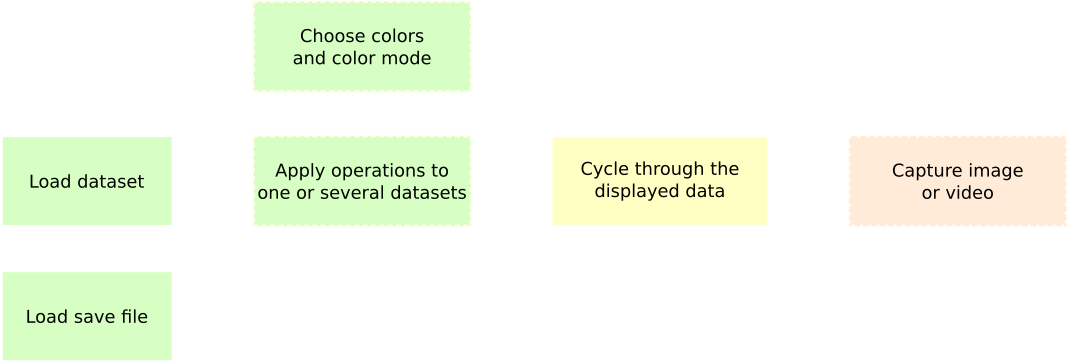
The basic workflow consists of loading data, either new sets or a save file, optionnally apply operations to these (for instance to display the mean values of datasets from several subjects) or change the displayed colors, and then being able to cycle through the data and move the brain mesh. This workflow is almost complete, the image/video capture is not finished yet.
TopographX can also create files that can be read by a web player, in order to share results and act as figures in research publications.
It is currently being used in several research projects at Paris Cité University and the AP-HP.
More info and downloads available here : Github page.